Hemisphere Capital Management Inc.

Time Weighted vs Money Weighted Return: What is the Difference?

When reviewing portfolio performance, investors often encounter two different return figures: Time Weighted Return and Money Weighted Return. These metrics can tell different stories about how an account has performed over time — because each answers a different question.

In this article, we will explore the key differences between time weighted vs money weighted return. We will discuss when each is most appropriate, and explain how various regulatory frameworks determine which return is most often reported.

What Is Time Weighted Rate of Return (TWRR)?

The Time Weighted Rate of Return (TWRR) shows how well an investment itself is doing, without being affected by money being added or taken out of a portfolio. It splits the total time into smaller parts whenever money goes in or out, then links those parts together to find the overall return.

In simple terms, TWRR answers: “how well did my investments perform?” regardless of when you added or withdrew money.

Pros of Time Weighted Performance:

  • Removes the effect of cash flows.
  • Better reflects an investment manager’s skill based on their investment decisions.
  • Standardized and comparable across different portfolios or managers.
  • Well-suited for benchmarking against indices.
  • Required by GIPS-compliant performance reporting.

Cons of Time Weighted Return:

  • May not reflect the experience of an individual investor if there are large cash flows in or out of the portfolio.

Time Weighted Rate of Return Formula (TWRR)

Rn = the return for each time period between money going in or out.

  • For example, if you were looking to calculate the time weighted performance for July, and cash flows occurred on July 10th and 20th, the sub-periods would be broken down to July 1st to 10th, July 10th to 20th and July 21st to 31st.

What Is Money Weighted Rate of Return (MWRR)?

The Money Weighted Rate of Return (also called Internal Rate of Return, or IRR) shows the return based on an investor’s personal experience. It looks at when and how much money is being added or taken out, and then finds one overall return rate that balances the money going in and out.

Put another way, MWRR answers: “how well did you do, considering when you invested or withdrew funds?”

Pros of Money Weighted Return

  • Reflects the return the investor earned based on actual cash flow timing.
  • May be more useful for goal-based planning.

Cons of Money Weighted Rate

  • Not suitable for comparing investment manager performance.
  • Cannot be used to benchmark against standard indices.
  • Discretion in recognizing timing of cash flows can impact performance.
  • Typically requires a program or spreadsheet to calculate the performance.

Money Weighted Rate of Return Formula (MWRR)

Solve for R in:

PVo = Present Value of Outflows

PVI = Present Value of Inflows

CFO = Initial Investments (cash outlay)

CF1, 2, n = Cash Flows

R = MWRR/IRR

When to Use TWRR vs MWRR

Use TWRR when:

  • You are comparing investment managers, funds, or strategies.
  • You want performance isolated from decisions on when money was added or taken out.
  • You need standardized, benchmark-aligned reporting.

Use MWRR/IRR when:

  • You want to assess the return you earned based on when you added or withdrew money.
  • You are reviewing your performance for goals-based purposes.
  • You are evaluating private equity, real estate, or other illiquid investments where cash flows are irregular and under investor control.

Understanding when to use each method is essential for clear, accurate performance evaluation.

Why TWRR and MWRR Can’t Be Directly Compared

A common misconception is that Time Weighted Rate of Return (TWRR) and Money Weighted Rate of Return (MWRR) are interchangeable or even comparable. They are very different and comparing them can be misleading. Each metric is designed to answer a different question.

    TWRR asks: “How well did my investments perform, regardless of when I added or withdrew money?”

    MWRR asks: “How well did I do, based on the timing of my contributions and withdrawals?”

Since they measure different things – and use different formulas – it is entirely possible for a portfolio to show a 5% TWRR and a 7% MWRR simply because the investor contributed new funds at an opportune time. That does not mean the investments underperformed or outperformed – it just means the timing of money going in and out impacted your personal performance.

Time Weighted vs Money Weighted: When Each One is Typically Higher/Lower

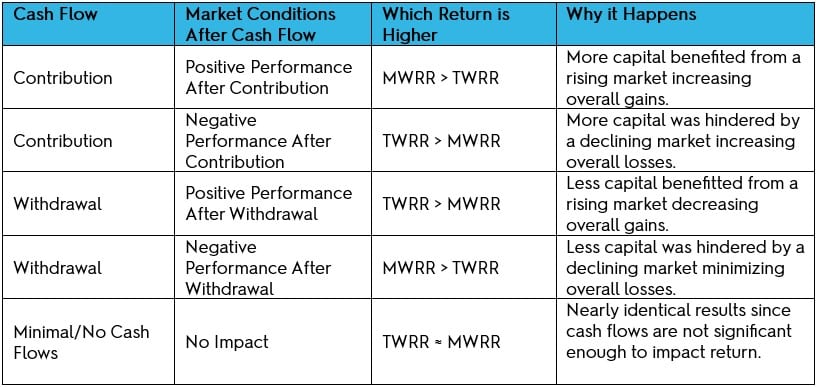
The table below outlines common scenarios where the MWRR is typically higher or lower than TWRR over shorter time periods. This is dependent upon the timing of cash flows relative to market performance.

An Example

Imagine three investors – Investors A, B and C – each starting with $50,000 in their portfolios on January 1. Their portfolios are managed by Financial Advisor 1. Investor A does not touch their portfolio all year. Investor B withdraws $10,000 on July 1 for some personal expenses. Investor C receives a mid-year bonus and deposits an additional $10,000 on July 1.  Their quarterly returns are:

  • Q1 +3%
  • Q2 –4%
  • Q3 +6%
  • Q4 +5%

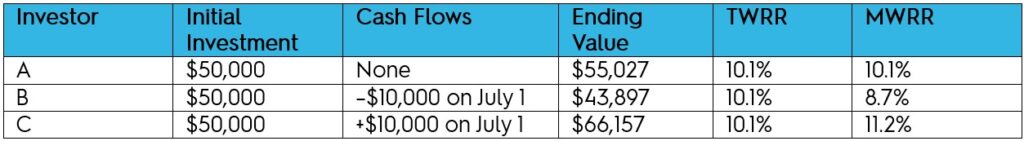
We can calculate the performance for this group of investors as shown in the table below:

Calculation Notes

The TWRR is calculated by linking the period’s return between each cash flow. Since all cash flows occur at the start of a quarter, we can link each quarter’s return:

 (1+0.03) × (1−0.04) × (1+0.06) × (1+0.05) −1 = 11.65%

The MWRR uses the internal rate of return formula in Excel (XIRR), accounting for the exact timing and amounts of cash flows to solve for the MWRR formula previously shown.

Why the Difference Between MWRR and TWRR?

Investor A has no cash flows, so TWRR equals MWRR.

Investor B’s withdrawal before a period of positive performance lowers their MWRR because money was taken out before the market rebounded.

Investor C’s additional investment right before a period of positive performance raises their MWRR because more money can benefit from better performance.

Comparing Financial Advisors

Now assume there are Investors D, E and F who start with the same initial investment and have the same cash flows, but work with Financial Advisor 2. Their quarterly returns differ from investors A, B, and C as shown below:

  • Q2 +2%
  • Q2 –2%
  • Q3 +5%
  • Q4 +4%

We can calculate the performance for the second group of investors as follows:

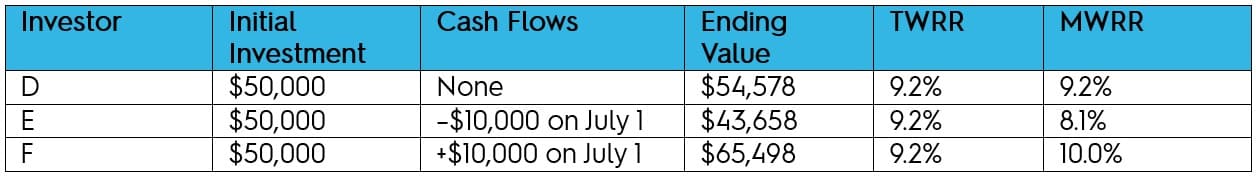
If we were to compare the MWRR between both groups of investors, we might conclude that Investor F performed similarly to Investor A and outperformed Investor B. We might then conclude that the performance of the two financial advisors varied with each individual investor and that one financial advisor did not necessarily outperform the other.

However, if we compare the TWRR – which excludes the effects of cash flows – it is clear that the performance of Financial Advisor 1 exceeded that of Financial Advisor 2 over the selected period. 

It should be noted that while looking at time-weighted performance is a more appropriate comparison, simply looking at performance is a simplistic analysis when evaluating a financial advisor. It is also important to try and understand what caused the difference in performance. Investors D, E and F suffered a smaller drawdown in Q2 so it is possible that Financial Advisor 2 was taking less risk and had lower returns as a result.  

The Global Investment Performance Standards (GIPS®)

The Global Investment Performance Standards (GIPS®), developed and administered by the CFA Institute, provide a globally accepted framework for calculating and presenting investment performance. One of the key requirements under GIPS is the use of Time Weighted Rate of Return (TWRR) for performance reporting. This is because TWRR eliminates the factors (i.e. cash flows) which are typically outside the control of portfolio managers. By neutralizing these factors, TWRR allows for a more accurate assessment of a manager’s investment skill and enables fair comparisons across portfolio managers and strategies.

Client Relationship Model 2 (CRM2)

Under the Client Relationship Model Phase 2 (CRM2) regulations introduced by Canadian securities regulators, investment firms must report the Money Weighted Rate of Return (MWRR) at least once per year. This requirement is intended to provide investors with a personalized view of their performance – one that reflects the impact from the timing and size of their contributions and withdrawals.

However, one consequence of this regulation is that many firms/banks now report performance exclusively using MWRR. While useful at the individual level, MWRR is not designed for comparing performance across managers or firms. As we noted when the CRM2 rules came into effect in 2017, the exclusive use of MWRR has reduced transparency and made it more difficult for many investors to make fair, apples-to-apples comparisons. This is particularly problematic when evaluating a potential switch between firms or assessing a manager’s effectiveness.

How Does Hemisphere Report Performance?

At Hemisphere, we follow the best practice guidelines set by the CFA Institute, calculating performance using the Time Weighted Rate of Return methodology for all quarterly reports. This ensures our clients receive performance data that reflects the underlying investment strategy, enabling fair and objective evaluation of our portfolio management. In accordance with CRM2 requirements, we also report clients’ Money Weighted Rate of Return annually, providing each client with a personalized view of their actual account performance. By offering both measures, Hemisphere gives clients the transparency they need to understand how their portfolio is performing and how we are performing as their investment manager.

Hemisphere Capital Management Inc. claims compliance with the Global Investment Performance Standards (GIPS®). Click here to learn more about GIPS® or for composite performance data in accordance with GIPS® presentation requirements. To obtain a GIPS® Composite Report, please contact us.

GIPS® is a registered trademark of CFA Institute. CFA Institute does not endorse or promote this organization, nor does it warrant the accuracy or quality of the content contained herein.

Disclaimer: This information is not intended to be comprehensive investment, tax or legal advice applicable to the individual circumstances of a potential investor and should not be considered as personal investment advice, an offer, or solicitation to buy and/or sell investment products. Every effort has been made to ensure accurate information has been provided at the time of publication, however accuracy cannot be guaranteed. Interest rates, market conditions, tax rules and other factors change frequently and past investment performance does not guarantee future results. The manager accepts no responsibility for individual decisions arising from the use or reliance on the information contained herein. Please consult a portfolio manager prior to making any investment decisions.